


简约风科技场景电路模拟插画素材
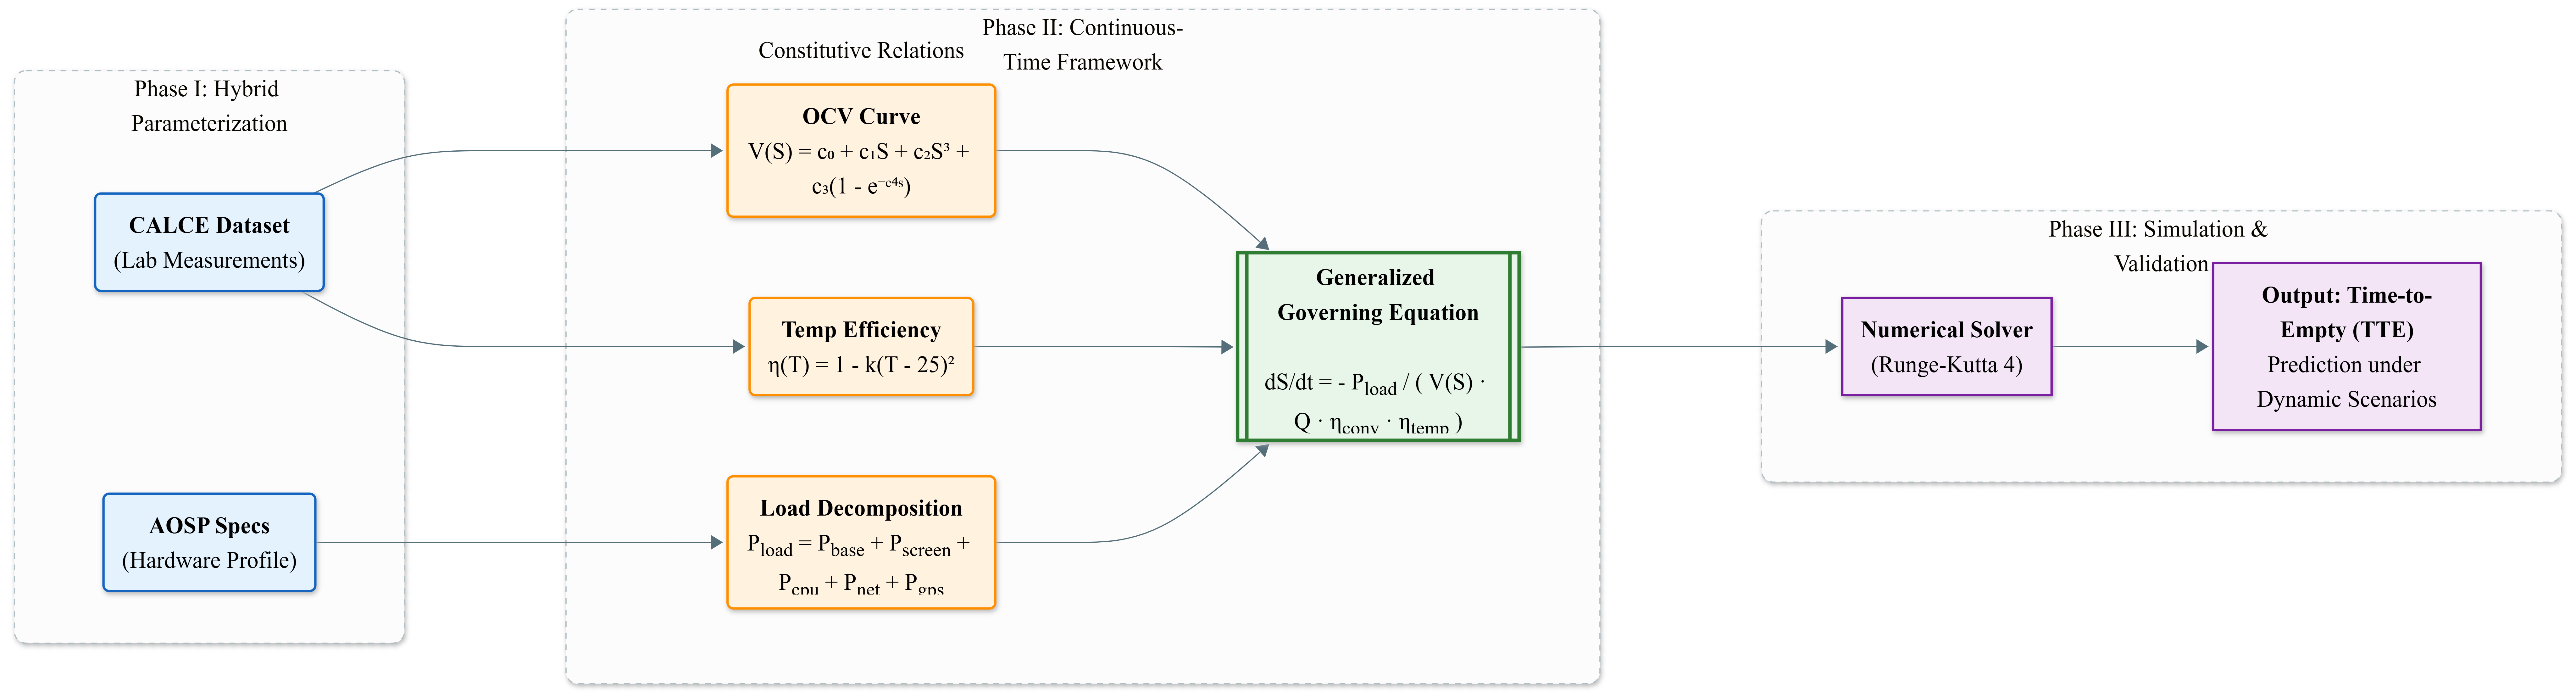
A professional scientific workflow diagram of a continuous-time smartphone battery model, arranged horizontally in three phases. [Left - Inputs]: Clean, flat-style blue icons representing "CALCE Datasets" (stacked charts) and "Hardware Specs" (document with gear). [Center - The Core]: A large central system block. Inside, three distinct modules converge: an orange graph showing a non-linear voltage curve, a red thermometer icon for thermal efficiency, and a silicon chip icon for processor load. Arrows from these three modules feed into a central green equation block representing "dS/dt" differential calculus. [Right - Output]: A purple panel showing a simulation solver loop leading to a smooth downward trajectory graph (Time-to-Empty). [Style]: High-end academic publication style (Nature/Science), vector illustration, clean white background, sans-serif aesthetic, distinct color coding (Blue, Orange/Green, Purple), precise arrows indicating causal flow, no clutter. --ar 16:9 --v 6.0


描述你想生成的图片信息,如:画面里有什么风格/元素/色彩
Shift+回车 = 换行
AI可能会犯错误或不完全遵循,请谨慎使用。
同款 0
评论 0